- Local data encouraging
- But global inflationary forces looming large
- We revert to expecting OCR hikes in October & December
- Upward pressure on mortgage rates
- House price expectations nudged lower
View as PDF
What have we learned over the past fortnight?
The tussle continues. Glimmers of light in the NZ economy continue to poke through the fog. But recent developments offshore are casting a shadow over these signs of domestic momentum. Inflationary pressures are more problematic, such that we’ve reverted to expecting two 25bps increases in the Reserve Bank’s OCR this year.
Local activity numbers decent
The past fortnight’s eco-numbers have mostly been encouraging. Notably, with anything consumer-related still lagging the upturn. In brief:
- August PMI indices (manufacturing and services) soothed fears that recent signs of life in the service sector might prove fleeting. The combined PMI/PSI index held in expansionary territory (>50.0) for the third straight month – a feat last seen in 2023.
- Tourism arrivals remain on an upward trajectory with a revival in previously lagging Chinese arrivals particularly encouraging (97% of pre-COVID levels in July, compared to 57% in January).
- Long-term migration numbers displayed clearer signs of an uptrend. Annual net inflows rose to just over 20,000 in July (long run average 30,000). Historically low, but increasing, population growth will add to demand as well as (labour) supply.
- Spending metrics depicted a still dispirited consumer. Card spending wobbled in August, roughly as expected (-0.5%m/m). Monthly spending values are still rising on a trend basis but only just. Westpac consumer confidence rose in Q3, but not meaningfully. It’s still weak and well below average.
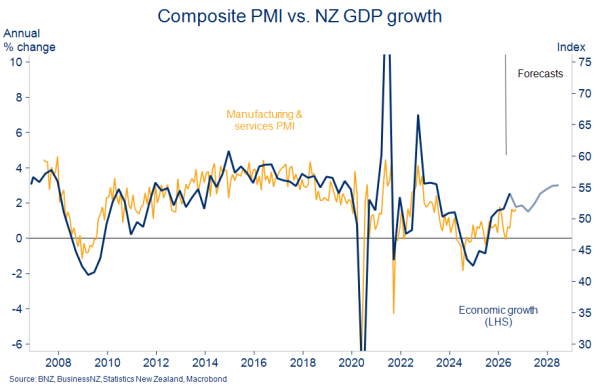
All told, the above plays to the grain of our view economic growth continued and perhaps strengthened a touch in the third quarter. We’ve pencilled in a 0.5% expansion to follow the 0.2% quarterly growth (2.6% annual) Stats NZ confirmed for Q2 yesterday.
PMIs consistent with ~2% annual GDP growth
But inflation looking more problematic
The resilient tone of recent data has unfortunately come through in the shadow of yet more unhelpful inflationary dynamics:
- Global oil prices are rising once more, as energy markets largely price out hopes for a short-term resolution to the conflict in the Middle East;
- Ocean freight costs are lifting again amid reports of Asian port congestion;
- The global memory shortage is continuing to put pressure on many aspects of IT spend; and
- Import costs generally are under upward pressure from a falling NZ dollar. The trade-weighted NZD plumbed 15-year lows this week as steep increases in global interest rates compress differentials to NZ.
Petrol prices biased higher
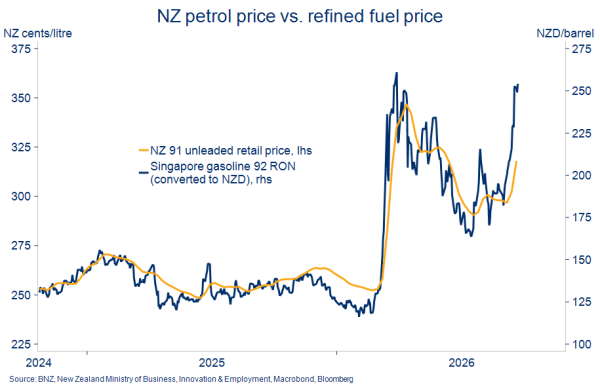
The risk profile continues to move around violently, questioning how much of recent moves should be built into forecasts. But the spike in oil prices has been such that we’ve had to nudge our fourth quarter inflation forecast up to 4.2% (from 3.8%). That’s based on an assumption petrol prices rise to about $3.30/litre by November and slowly drop back thereafter.
Interest rates rising
Such has been the shift in inflationary dynamics in a short space of time that we now believe the Reserve Bank will raise the Official Cash Rate 25bps at both the October and December meetings. We’d previously forecast just a December lift following the Bank’s strong guidance toward such earlier this month.
Globally, central banks are becoming increasingly concerned about heightened inflation. There’s been some dramatic lifts in offshore interest rates. Against this backdrop, local financial markets have been steadily lifting local rate hike expectations over the past week or so.
Current pricing embodies around a 75% chance of two additional OCR hikes this year, with the peak in the cycle now seen not far from our own 3.75% forecast. This repricing has, in turn, underscored a 20-35bp jump in wholesale (swap) yields over the past week or so.
Upward pressure on mortgage rates
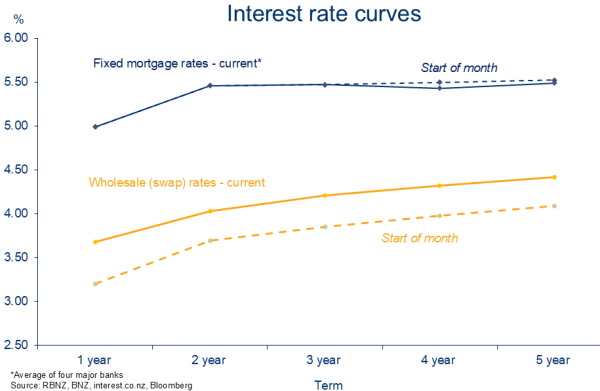
That puts extra pressure on retail interest rates to lift unless wholesale yields were to soon back off again. Whether the latter occurs is a difficult judgement to make given the many drivers involved! But, in light of our updated OCR forecast, our view is that at least some of the recent interest rate gains will be sustained.
Housing market under pressure
Earlier lifts in mortgage rates would add further drag onto the housing market. It’s already under mild strain from a weak labour market, a wary consumer, and uncertainty from the upcoming election. Rising net migration and an economy finding its feet are providing ballast.
There were no signs in Tuesday’s August REINZ housing data of a momentum shift. If anything, there were hints of further slippage.
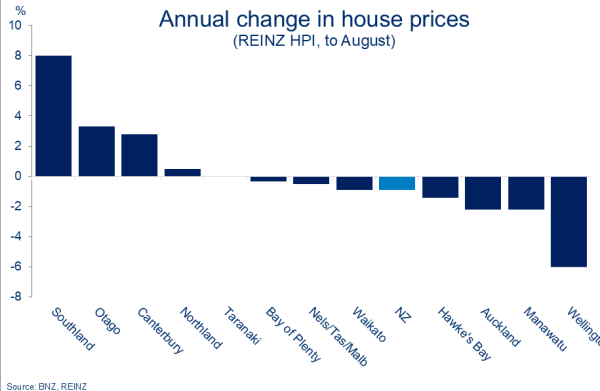
House prices fell 0.3% in the month (REINZ House Price Index, all housing data seasonally adjusted). This was the third consecutive small decline, meaning national house prices are now 0.9% below year-ago levels. Beneath that national figure is the now familiar spread of regional performance.
Canterbury and The South vs. The Rest
We were most interested in the activity indicators. Houses are now taking about as long to sell (median of 48.1 days, s.a.) as they were two years ago. Monthly housing turnover slipped another 4% (s.a.) in August and is now a bit over 10% below the ‘average’ sorts of levels that prevailed in January.
Monthly sales numbers are consequently more clearly falling short of new listings, adding to the stock of unsold inventory in the market. The 6.1 months worth of inventory in August was the highest since early 2023. And bear in mind that all of this predates the recent ructions in interest rate markets.
House sales falling short of listings
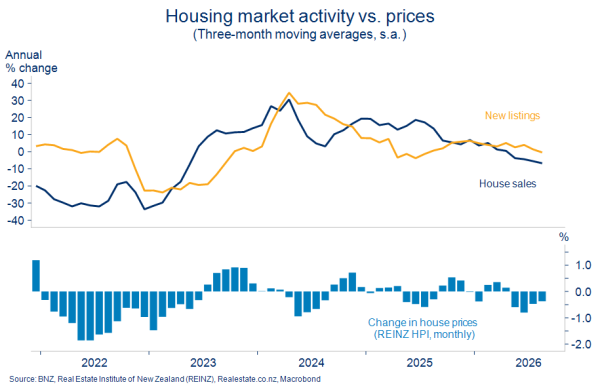
We’re left doubtful house prices will post the small gains between now and year-end implicit in our flat forecast for calendar 2026. We’ve thus tabbed down our expectations in line with the downside risk previously flagged.
Small monthly house price declines are assumed for the remainder of the year, producing a -1.0% forecast for calendar 2026. A small 2.0% lift is assumed for calendar 2027. If realised, these sorts of numbers would imply real house prices continuing to fall through to about the middle of next year.
To subscribe to Mike’s updates click here.
- Economy & Markets