- Annual rent inflation on the full tenancy stock is flat, a restraining force on otherwise elevated CPI inflation
- Rents on new tenancies are showing some signs of life. The tentative recovery is likely to continue
- We estimate average cash costs of home ownership are still above those of renting, although the gap has narrowed in recent years on our (indicative) numbers. That’s coincided with additional first home buyer housing demand
- But cost relativities starting to widen again as interest rates rise, with house prices a key uncertainty
Are rents starting to turn? Rent inflation on the full stock of tenancies is flat and likely to remain so in the short-term, but the more market-sensitive new-tenancy measures are showing some signs of life.
The full stock of rents: flat
Official data released on Friday showed annual rent inflation across the full stock of tenancies was effectively flat in September (technically +0.06%). It was the second straight flat read – August’s 0.0% was the lowest annual print in a series stretching back to 2007.
The low numbers are not especially surprising. Rental inflation on newly agreed tenancies - the faster-moving “flow” measure – started weakening back in early 2024. Existing rents are adjusted less frequently, so it takes time for changes in market conditions to wash through to the full rental stock.
Rents stabilising
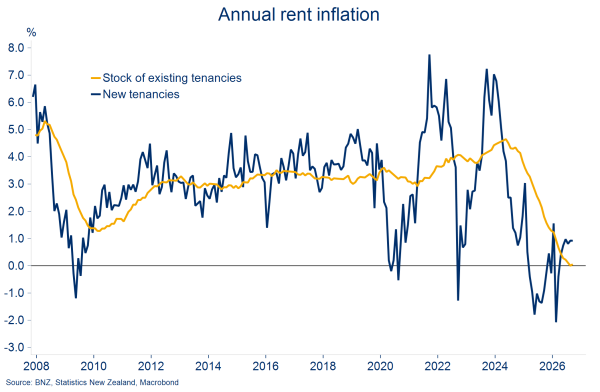
Given the slow-moving nature of the beast, we’re not expecting much to change in the short-term. Annual rent inflation is expected to hold just above zero for the next quarter or two.
This stock measure is the one used in the Consumers Price Index (CPI). With rents carrying the CPI’s largest individual weight (11.2%), they will remain a restraining force on otherwise elevated headline inflation in the short run.
New tenancy rents: signs of life
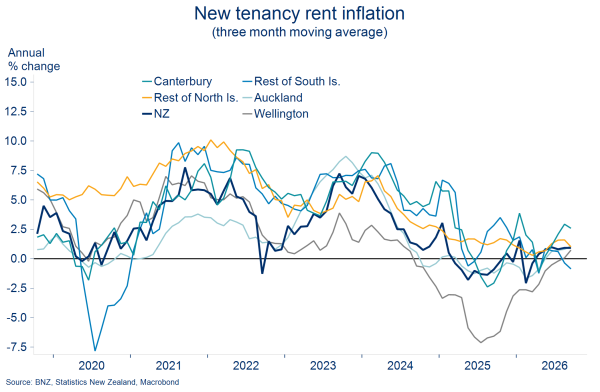
There have been a few more signs of life in new tenancy rents. Annual inflation in the flow measure held at 0.9% in September and has now been in positive territory since April.
It’s still a case of stabilisation rather than acceleration. Zoom out from the latest month and new tenancy rents remain roughly flat on where they were in mid-2024, having sagged through 2025.
The stabilisation has been helped by some regional convergence. Canterbury rents are still rising the fastest, but Wellington’s prior underperformance has become much less severe over the past year.
Regional convergence
What can we say about the outlook?
Our best guess is that new tenancy rent inflation will continue its tentative recovery and grind up towards 1½- 2½% over the next 12-18 months. That would be a little below the 3% long-run average.
Supply is becoming less abundant…
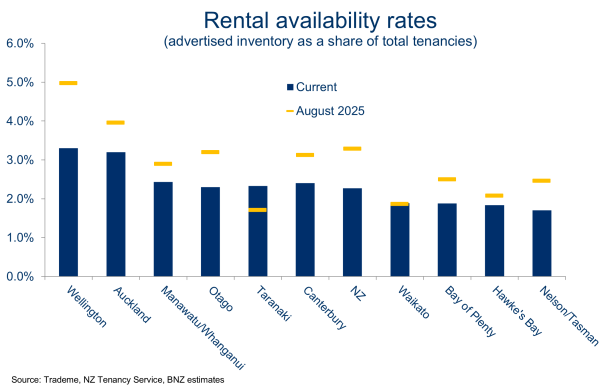
First, the extent of the previous excess of rental supply appears to be reducing. Last year’s flood of new rental listings has levelled out. According to realestate.co.nz, annual average new listings growth slowed to 6% in September, down from last year’s 33% peak.
Alongside firming population growth, this has begun to pull down rental availability rates from the highs of last year (see chart). Our indicative national estimate is currently 2.3%, down from a little above 3% a year ago. Auckland and Wellington still stand out as comparatively well supplied, just less so than previously.
Less loose
…but still looks ample overall
Nonetheless, we doubt the rental market will shift to a position of outright excess demand anytime soon. Population growth is expected to remain low and forecast home building rates (see our recent construction note) look more than ample to accommodate it.
The cycle is turning
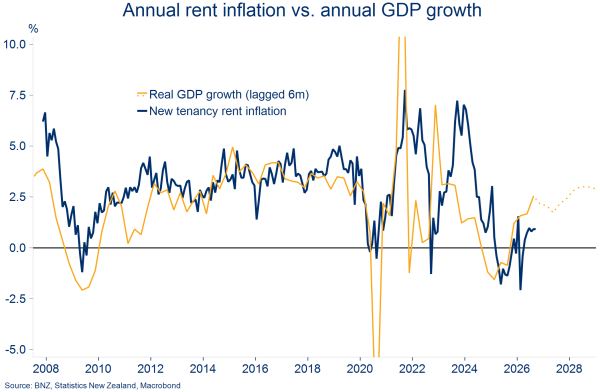
Then there is the economic cycle. Treasury research suggests that the improving wage and household-income growth in our forecasts should place a little more upward pressure on rents as the cycle turns. These factors, bundled in with others like employment growth and interest rates, help explain the close relationship between new rent inflation and GDP growth in the chart below.
Cycle turning implies firmer rents
How do rents compare to home ownership costs?
So, rents have been flat for 2½ years but might be starting to move. At the same time, rising mortgage rates are adding to the costs of home ownership. We thought it was a good time to update our estimates of the relative (cash) costs of owning vs. renting.
As always, the trick is to get as close as possible to an apples-with-apples comparison. Simplifying assumptions are necessary, meaning the results are indicative only. See the box below for the full list of assumptions!
The TL;DR version is we’re comparing the annual cost of entering a new rental tenancy with the annual cash cost of purchasing and running a median-priced home. The chart below plots these estimates as a share of household income. On our high-level numbers, it’s still more expensive to service a new house purchase than to pay roughly equivalent rent costs.
However, the gap between the two has narrowed significantly over the past 2½ years. Home ownership costs have declined as a share of income as flat-to-falling house prices and lower mortgage rates have offset higher costs from rates, insurance, and maintenance.
Narrowing relativities
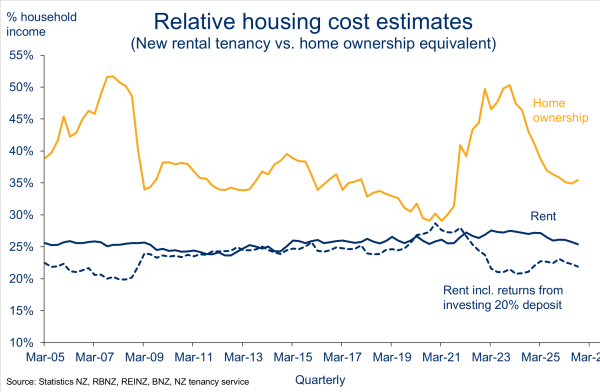
Our current estimates put the annual cash ownership costs for a new house purchase at around 35% of median household incomes. That compares to a peak of 50% back in 2023. Rent costs, by comparison, have held close to 25% of household incomes, or a little lower once deposit earnings are allowed for (see the box below for why these need to be added back).
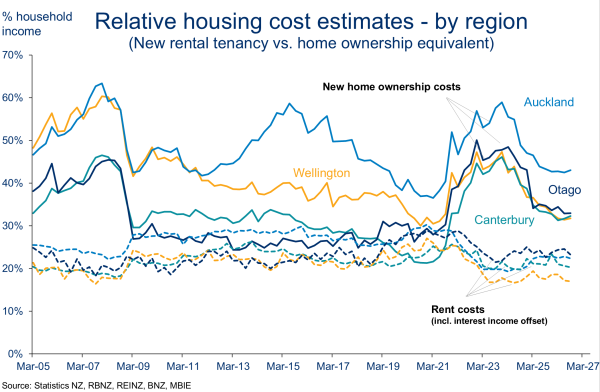
By region, the largest difference between renting and ownership costs is in Auckland. This reflects Auckland’s higher house prices and the additional debt servicing required.
Wellingtonians might be bemused to see their new ownership costs being estimated as (just) below those in Canterbury. Contributing to this is the fact Wellington house prices have fallen by more than elsewhere but it is, in fact, Wellington’s relatively higher incomes doing the work here – on a pure cash basis, ownership costs for Wellington are the second highest in the country.
Auckland has the largest gap
The narrowing relativities between new ownership and renting costs in recent years has, perhaps unsurprisingly, coincided with increased participation in the housing market by first home buyers (FHB).
But we wonder if some of this FHB demand might be tempered in future now that buy vs. rent cost relativities are just starting to widen again.
Higher mortgage rates are the key driver here. And given they’re likely to continue rising, some further modest widening in these housing cost relativities can be expected in coming quarters. However, our forecasts don’t imply anything like the sharp run-up in home ownership costs of 2021-23.
Where’s break even?
So far, we’ve deliberately side-stepped the role that expected capital gains (or losses) can play in the own vs. rent equation. We’ve focused only on cash costs, mainly to keep the comparison like-for-like.
But what happens to house prices often ends up being the key swing factor. A favourable house price revaluation can easily offset, on paper, the higher day-to-day operating costs of owning a house.
Indeed, for large chunks of history strong house price appreciation has done just that. It’s impossible to know whether those days will return but our suspicion (and indeed our forecasts) imply it will be much more of a close-run thing than in the past.
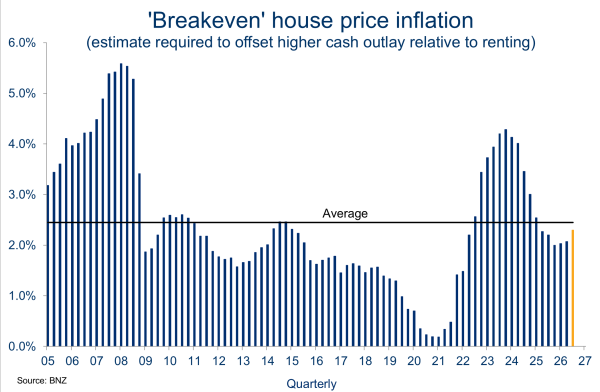
For example, in the current environment, a 2.3% increase in the median house price would, again on paper, offset the relatively higher cash costs of purchasing and running a house relative to renting.
Below, we plot this concept of the “breakeven” rate of house price inflation over time. The current 2.3% estimate for Q3 is higher than recent history but is still just below the long-run average.
Just below average
We admit the concept may be a more important consideration for those with an investment mindset. Indeed, none of what we’ve outlined here makes any allowance for the non-financial benefits of owning a home. That’s things like security of tenure and being able to hang your pictures up. For many households, these factors will matter more than the numbers dropping out of our spreadsheet!
Assumptions
Ownership proxy
- A median house ($765k as at September) is financed with a 20% deposit and the remaining 80% as (interest only) debt. Principal repayments are excluded as they are equity/savings. Interest costs are split equally across 6-month and 2-year fixed mortgage rates.
- To these financing costs, we add estimates of typical maintenance, rates, and insurance costs. For the September quarter, these comes in just under 2% of the median home price (around $14.5k on the $765k median). This estimate has increased from 1.5% four years ago.
- Capital gains or losses are not included as we’re only comparing the first year of cash costs.
Renting proxy
- A new tenancy is entered into at the current NZ average rent ($570/week), scaled up by 10% to reflect the median rental home value being below that of the median home.
- To make it a fair comparison, we subtract from the rental cost the after-tax returns from leaving the 20% deposit – used to finance the house purchase above – in the bank earning interest (we assume a six-month term deposit). Assuming the deposit is instead invested in the share market, earning potentially higher returns, doesn’t change the thrust of the results.
To subscribe to Mike’s updates click here.
- Economy & Markets