- Outlook for residential building activity subject to a range of cross currents, in a changeable macro picture
- We set out four macro positives and three negatives
- The net of these lean toward an uptrend taking hold, but only a tepid one. Our forecasts are weaker than the RBNZ’s
- Recent gains in consents, and firm building intentions, bolster the short-term outlook
The start of something?
There was a splash of excitement earlier this month on news the construction sector made one of the strongest contributions to second quarter GDP growth.
Fair enough too. The sector has endured a near five-year downtrend. Over which time residential construction volumes have contracted by a quarter.
Construction is a sector that can punch above its weight when it comes to influencing NZ’s economic cycle. So, the 4.4% quarterly increase in residential activity – the best since 2021 – was certainly encouraging. Few will be surprised to see Canterbury topping the pops amongst our estimates of the regional breakdown.
Canterbury in front
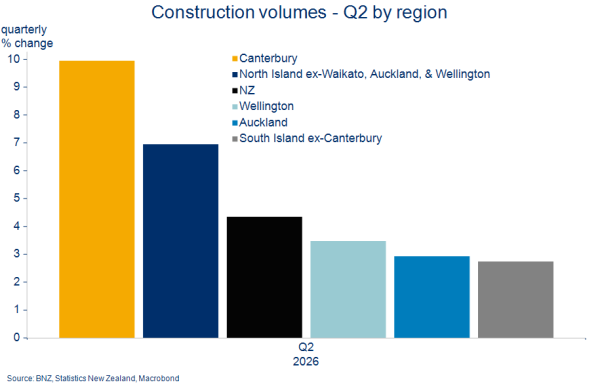
The question being asked now is – do the Q2 gains mark the beginnings of a trend? Our forecasts give a weak thumbs up, but recent events muddy the waters considerably.
Below, we stack up some of the factors for and against, as they currently stand.
Reasons residential construction might struggle
(1) Relative costs troublesome
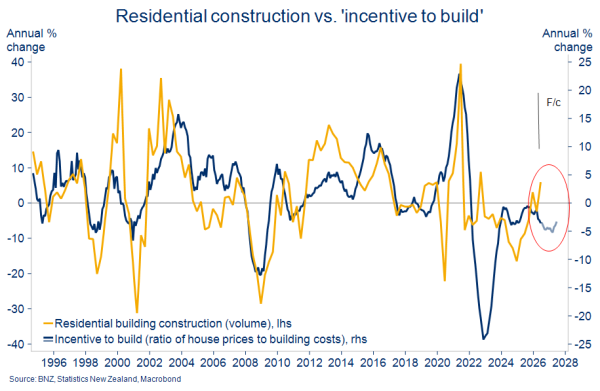
Small declines in residential property prices resumed over the three months to August. We expect more of the same through to year-end, and broadly flat house prices through to mid-2027.
At the same time, construction cost inflation has started to lift again. That’s after three years of sideways-ish consolidation in the wake of the 2021/22 cost explosion.
It’s not yet clear how much of an additional impost higher global fuel and petrochemical prices could be for construction inputs like transport, plastics, paint, freight, diesel, and so on. The direction is clear enough. And the falling NZ dollar will be an additional headache given the high import intensity of some materials costs.
Surveyed measures of construction costs and pricing intentions, such as those from ANZ and the NZIER, had been rising even prior to the latest spike in energy costs.
Upward pressure on costs
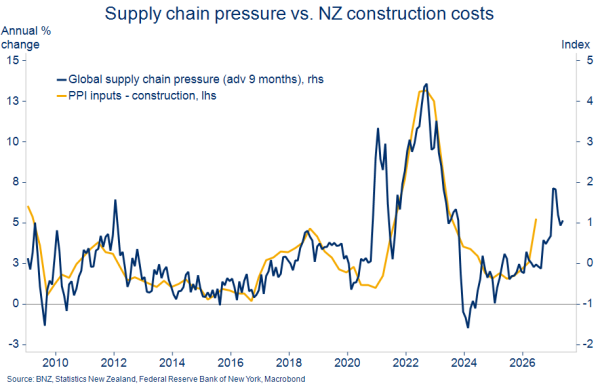
Flat house prices set against our assumption of small increases in construction costs means the ratio of the two – a rough “incentive to build” proxy – is biased to fall a little further from here (chart below). In short, the economics of building, at least at a top-down macro level, still look challenging.
House prices flat, construction costs up
(2) Rising interest rates
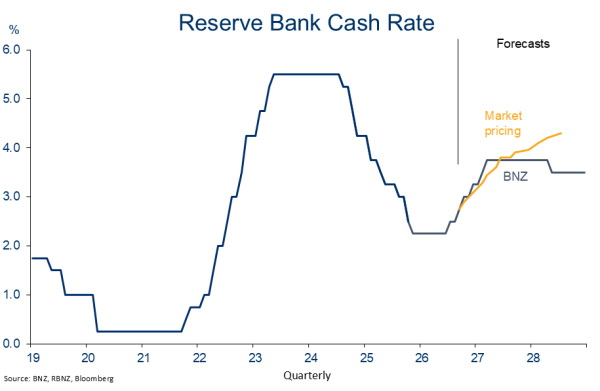
The Reserve Bank (RBNZ) has lifted the OCR twice so far this year to 2.75%. Our forecasts have an additional 25bp increase built in for every RBNZ meeting from here until a peak of 3.75% is reached by March.
So, while interest rates are still relatively low in a historical sense – below “neutral” in the parlance of economists – financing costs are likely to keep rising into next year. This is not just a NZ story, but part of a global interest rate re-pricing as underlined by the recent jump in global government bond yields.
Interest rates to rise further
(3) Low population growth
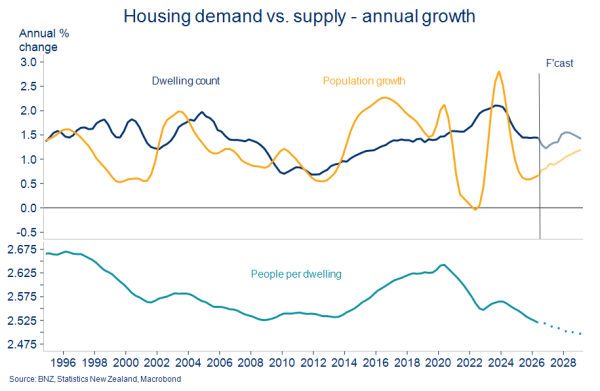
Population growth is expected to slowly increase but to still low rates. Our forecasts have annual growth staying south of 1% all through next year.
If so, it’s likely the marginal rate of home building will remain above that required to absorb population growth, as it has for the past two years. In other words, we’re (thankfully) a long way from the 2013-2020 period of underbuilding and associated rising people-per-dwelling.
Supply growth > demand growth
Reasons construction growth can keep going
Moving now onto the factors permitting a little more optimism…
(1) Consenting bulge
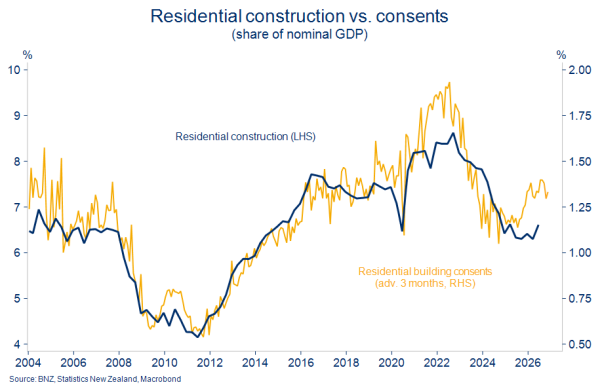
First, and most obviously, consents have punched higher. Residential building permits lodged in the year to August were 21% higher than a year ago.
Lead times from consents to building work can vary, and of course consents are not always acted on. Industry participants have recently flagged that consents are not being converted into activity as reliably as in the past. We’ve also heard reports of developments being paused or scaled in response to weak market conditions.
Historically, Stats data points to a consent completion rate of over 90%, but this number might have eased a bit recently. Even so, there appears to be enough in the pipeline to support higher levels of building work over the coming 6-9 months.
Consents gesturing upwards
We’re quick to flag that the consenting uplift is very uneven across regions. Canterbury, (central) Otago, and Auckland are leading the way, with parts of the central /lower North Island yet to experience much of an increase.
Regionally uneven
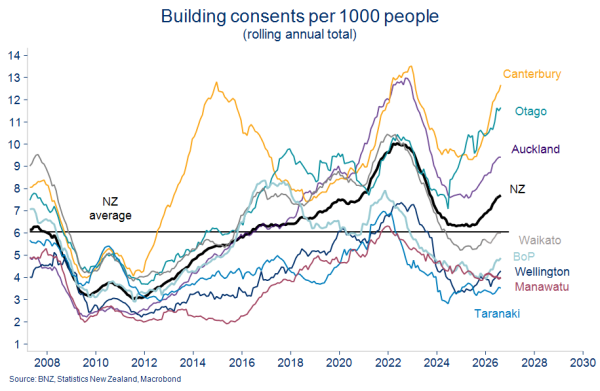
On the face of it, building consents per-capita in Canterbury hitting highs not seen since the 2014 post-earthquake rebuild seems remarkable. However, bear in mind the shift towards building townhouses, each housing fewer people, distorts the picture a little.
Over 40% of new residential consents nationwide are now townhouses. Auckland has the highest share at 53%. Looking instead at consented floor area rather than simply consent numbers (still per-capita), we estimate consents in Canterbury are still 25% below the 2014 peak.
(2) Confidence despite the challenges
Surveyed confidence readings from the construction industry still lean toward optimism, and increasingly so over the past few months.
A net 56% of respondents to ANZ’s September business confidence survey expect output in their business to increase over the coming 12 months. Surveyed hiring and investment intentions in the sector are well above average.
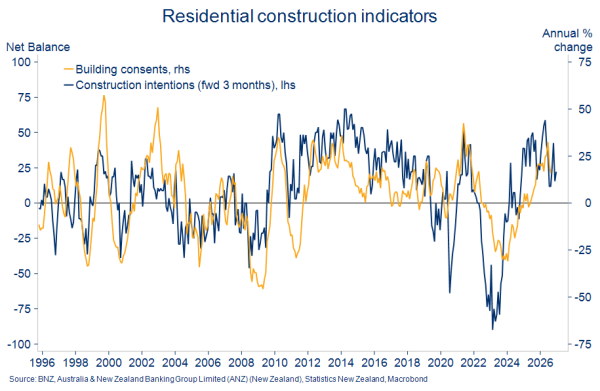
It’s possible some of this confidence might relate more to infrastructure work than residential building (more on this later). Regardless, residential construction intentions are also elevated. This intentions series did a good job in front-running the recent bounce in consents (per the chart below) and continues to signal decent growth in consent issuance over coming months.
Construction intentions point to firm consenting
(3) The cycle
Residential construction activity is strongly linked to the state of the NZ economic cycle, and we expect a cyclical uplift over the next few years.
Construction is positively correlated with economic growth, incomes, house prices and confidence. But the correlation also works back in the other direction via the sector’s ties to the likes of manufacturing, forestry, durables consumption, and logistics.
(4) Policy changes
A raft of government policy changes have been rolled out in recent years aimed at boosting housing supply. Things like freeing up land for development, adjusting density/zoning, incentivising and speeding consenting, changes to infrastructure funding, and expanding the range of allowable building materials.
These reforms may help loosen supply-side rigidities and reduce cost – facilitating additional house supply over time. We’d note, though, that demand appears to be the more immediate constraint at this point in the cycle.
So which side wins out?
If the above proves anything it’s that there are plenty of cross currents shrouding the outlook for residential building.
In trying to net the factors “for” and “against”, we make the following judgements:
- · A turning in the broader economic cycle is consistent with an upswing in residential construction activity
- · A flat property market set against rising costs, sub-par population growth, and rising interest rates all raise questions about the strength of that uptrend
- · The gains in building consents already seen, and firm intentions for the coming 12 months, provide more comfort in the short-term outlook
Recovery underway
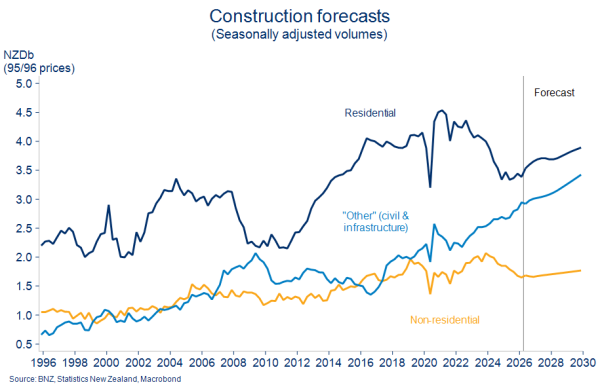
In what remains a highly changeable macro picture, our forecasts attempt to balance these judgements. We do think the residential construction cycle has turned. And we’re expecting continued modest growth in activity over the next 9-12 months. But that is part of what we’ve assumed as a tepid overall uptrend. Our forecasts remain noticeably weaker than the Reserve Bank’s, for example.
We continue to hold a stronger outlook for what Stats NZ term “other” construction, a classification that mostly captures civil and infrastructure work. That’s consistent with the large and increasing pipeline of work estimated by the Infrastructure Commission and MBIE. The former estimates that $71b of infrastructure projects are underway, with a $96b pipeline of fully funded initiatives in the pipeline.
- Economy & Markets