- Economic momentum maintained
- Still lopsided under the hood
- Slumping NZ dollar adding to cost concerns
- Inflation outlook warrants higher interest rates
- Households prepared
Chart 1: Who will do the heavy lifting next year?
Despite the odd freak-out, the global economy has, in aggregate, continued to chug along at close to trend growth rates this year.
At 3.2%y/y, consensus global growth forecasts for 2027 are marginally better than this year’s and, on net, have been nudged upwards as the year has progressed.
Among NZ’s trading partners, China, the US, and South Korea are expected to keep doing the heavy lifting. All three share heightened exposure to the AI trade. Australia, meanwhile, has slunk to the back half of the field, having suffered a large downgrade for 2027.
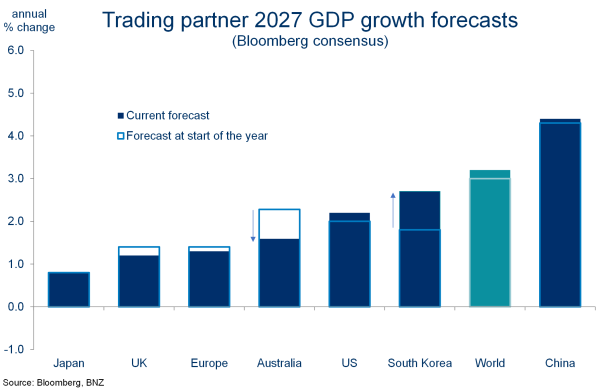
Chart 2: NZ momentum maintained
The official read on NZ economic growth is 2.6%y/y as at June. Our forecasts have a near 2% annual run-rate being maintained over the coming 18 months.
This expectation will of course be tested. But we’re encouraged that high frequency data to October remain supportive. That’s even as pre-election nerves jangled and petrol prices hit fresh highs.
The October composite (manufacturing & services) PMI released on Monday hit a high not seen in 3½ years.
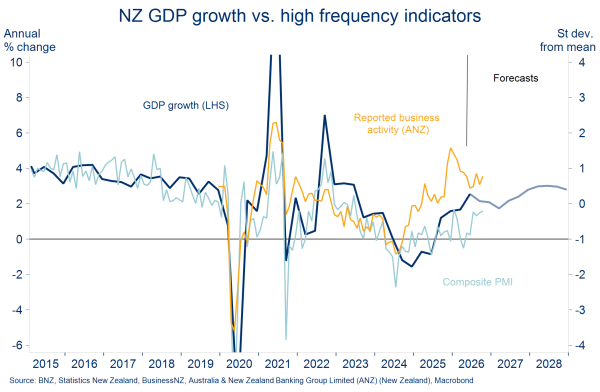
Chart 3: Lopsided under the hood
Beneath the top-line of reasonable economic activity is a still lop-sided sectoral picture.
Witness our GDP component forecasts for calendar 2026. Annual average private consumption growth is seen at 1.1%, about a third of the long-run average. Exports, meanwhile, boom at almost double theirs.
We’ve seen few signs this divergence is about to narrow. Tourism arrivals and export price data continue to impress while, admittedly patchy, retail card spending figures depict a consumer still under the cosh.
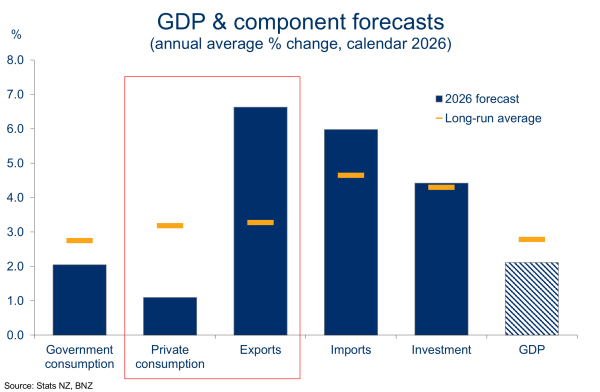
Chart 4: Another hiccup for housing
Consumers’ restraint can at least partly be traced to a soggy housing market. Far from finding its feet, October REINZ data showed the market losing ground at a slightly faster rate.
Pre-election caution might overstate the weakness. But it’s clear house sales continue to undershoot new listings. This is swelling the stock of unsold inventory and weighing on prices.
The REINZ national house price index fell another 0.5% (s.a.) in October, its fifth straight monthly decline. We think prices will finish 2026 about 2% lower than 2025.
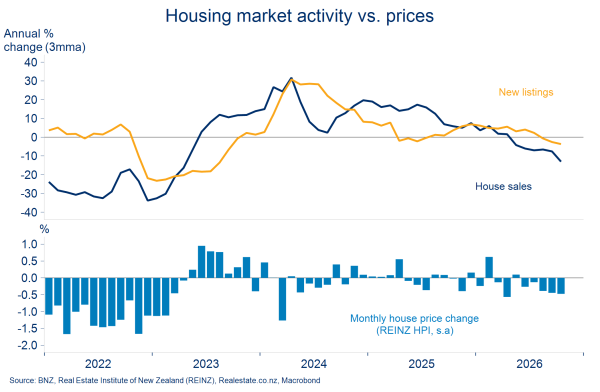
Chart 5: Misery index peaking?
It’s been an objectively “miserable” environment for consumer spending. So says the misery index – the sum of NZ’s annual inflation and unemployment rates.
The index has been going in the wrong direction for two years. The current (Q3) reading is 9.4%.
On our forecasts, a less miserable consumer backdrop beckons for next year. We expect both unemployment and inflation to fall – each an important precondition for consumers to find a little more confidence.
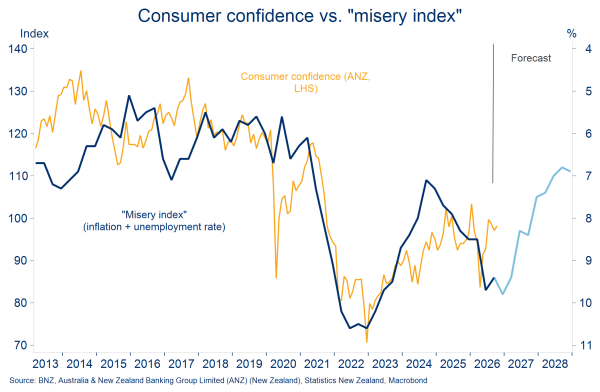
Chart 6: Low(er) on fuel
Falling fuel prices should take some pressure off household budgets, pressure that was plain to see in October's retail card spending numbers.
91 petrol prices are a bit over 25c off their recent highs. Further falls are likely, provided the recent drop in refined fuel costs holds.
These developments have also allowed us to trim our fourth quarter CPI inflation forecast a few tenths, to 4.3%y/y. We have that pencilled as the peak.
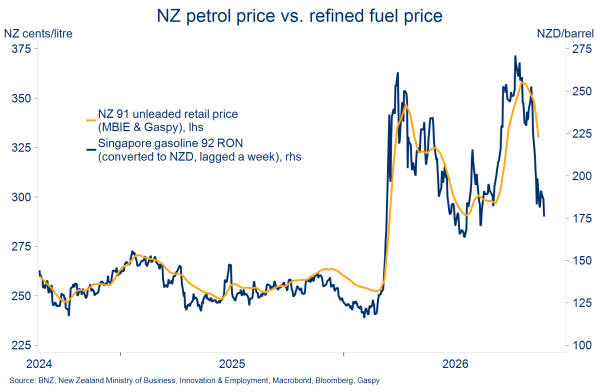
Chart 7: Inflation not all fuel
Beneath the fuel price-driven volatility, underlying inflation in NZ remains too high. Especially considering the weak economy of the past few years.
The core inflation measures followed closely by the Reserve Bank mostly increased in Q3, to be narrowly clustered around 3.0%.
Price increases are becoming more widespread. Around 61% (s.a.) of all items in the CPI increased in price in the third quarter. A share above 60% has occurred in only nine quarters of the past 20 years.
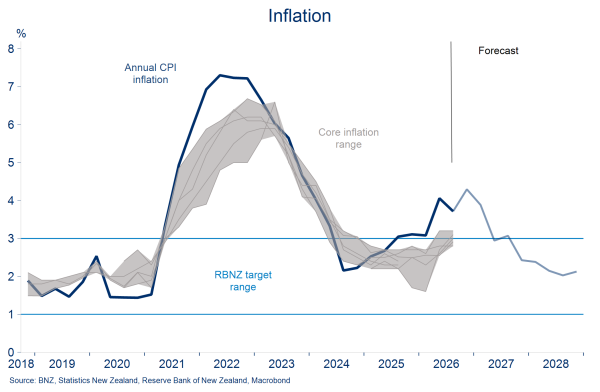
Chart 8: Kiwi takes fright
The renewed slide in the NZ dollar will only be adding to the cost pressures facing importers, some of which will be passed through to higher consumer prices.
The NZD/USD tumbled to fresh 19-year lows below 0.5500 this week. The downdraft saw the trade-weighted NZD (TWI) also mark a 19-year low, almost 6% below the Reserve Bank’s September TWI assumption.
Our currency forecasts imply only a weak recovery from here. One of the main weights on the currency – negative interest rate differentials relative to peer countries – is likely to stick around.
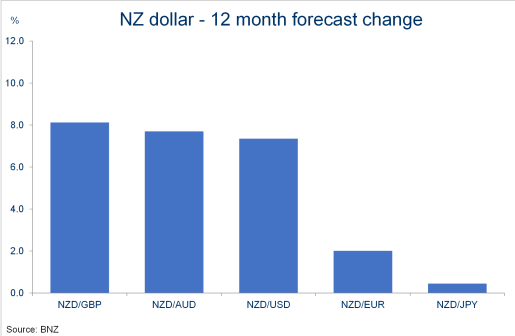
Chart 9: Interest rates still biased higher
We still think the Reserve Bank will lift the cash rate 25bps to 3.00% next month.
Such a move is warranted, we think, given the less-than-comfortable inflation outlook. The recent news flow may have soothed some MPC members’ worries about the domestic recovery, but perhaps less so the global backdrop.
Our forecast OCR peak of 3.75% by May remains, although we acknowledge the Reserve Bank might throw in a few more pauses along the way. That’s something more obviously reflected in market pricing.
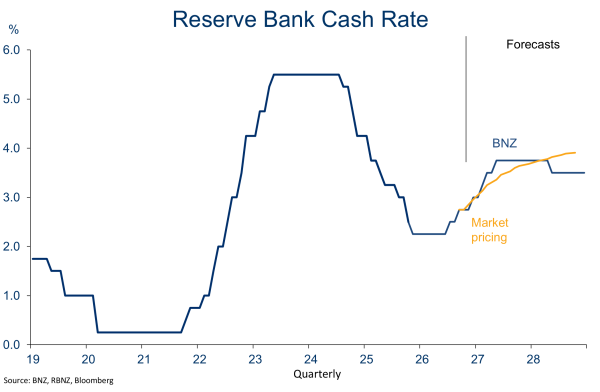
Chart 10: Households are prepared
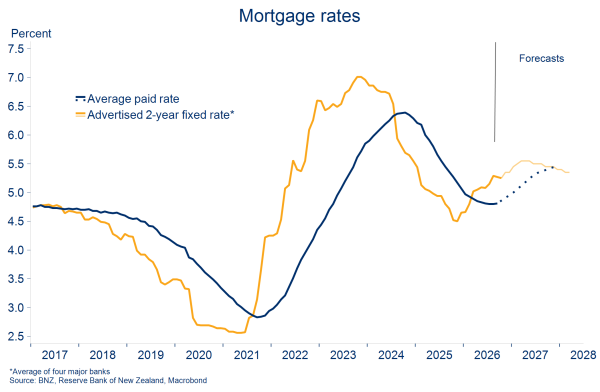
That 120bps or so of OCR hikes are already baked into market pricing is important. It will limit how much further fixed mortgage rates rise even as floating rates keep climbing. Our forecasts have fixed rates 20-50bps higher by March.
It’s also notable that the average mortgage rate being paid by borrowers is yet to increase. As of September, it was 4.81%.
We think it will rise to about 5.4% over the coming 12 months. Households have seen higher rates coming and hedged appropriately, implying a more gradual lift than otherwise.
To subscribe to Mike’s updates click here.
- Economy & Markets