- Spending indicators brighten
- Details less convincing, as fuel volatility adds noise
- Migration trend looking flatter
- List of spending restraints is long, but peaking “misery index” provides hope
- Mortgage rates catch up, OCR forecasts unchanged
The economy is finding its feet again after an autumn wobble. But what about the beleaguered NZ consumer?
We’ve rummaged through the retail aspects of the past week’s data to get a feel for the spending pulse in the aftermath of the April/May fuel price spikes.
1. July electronic card spending
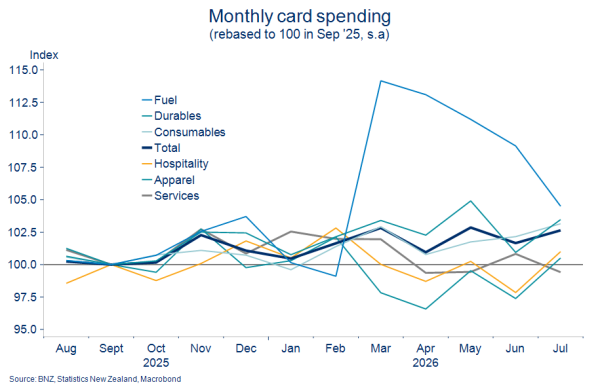
The 1.0%m/m bounce in card spending from June to July was encouraging. It reversed most of the June decline, returning the value of monthly spending back to around the highs for the year (all seasonally adjusted).
There was a strong element of July fuel price declines breathing a little bit of life back into discretionary spending. Indicative of such, the hospitality and apparel categories posted the strongest monthly gains of about 3%. Both nonetheless remain about 2% below (February) levels prevailing prior to the fuel price shock.
Fuel price volatility shifting spending patterns
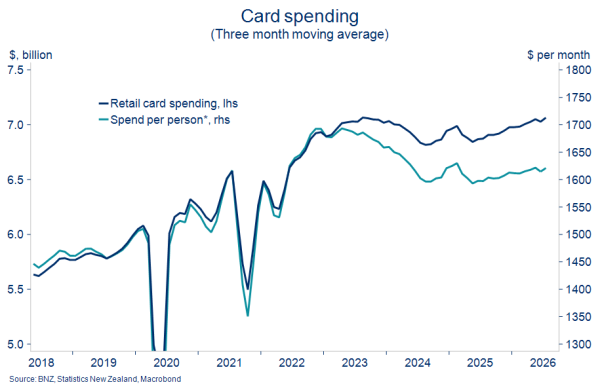
Stepping back, the uptrend in monthly card spend, now just over a year old, remains in-tact. But you certainly wouldn’t describe it as vigorous, particularly when viewed on a per-capita basis.
Spending as of July is only just getting within cooee of the peak back in August 2023. These data are simple dollar values. Adjusting for inflation produces an even flatter profile.
Card spending creeping higher
2. July Performance of Services (PSI) Index
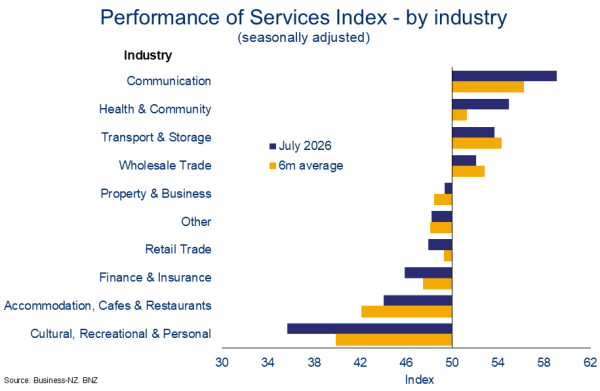
July’s PSI, also released on Monday, featured a shiny veneer but slightly scratchier details. The headline index held above the 50.0 level indicating expansion. That’s a feat achieved in only three months so far this year including, encouragingly, the last two consecutively.
But at least part of the recent improvement appears to reflect a build-up of inventories, warranting some caution in extrapolating the recent better numbers. Some of the more cyclical and consumer-focused subcomponents – retail trade, accommodation & cafes/restaurants, and cultural & recreational – also remain well below 50.0, and little changed on the six-month average.
Mixed in the detail
3. July BNZ card spending
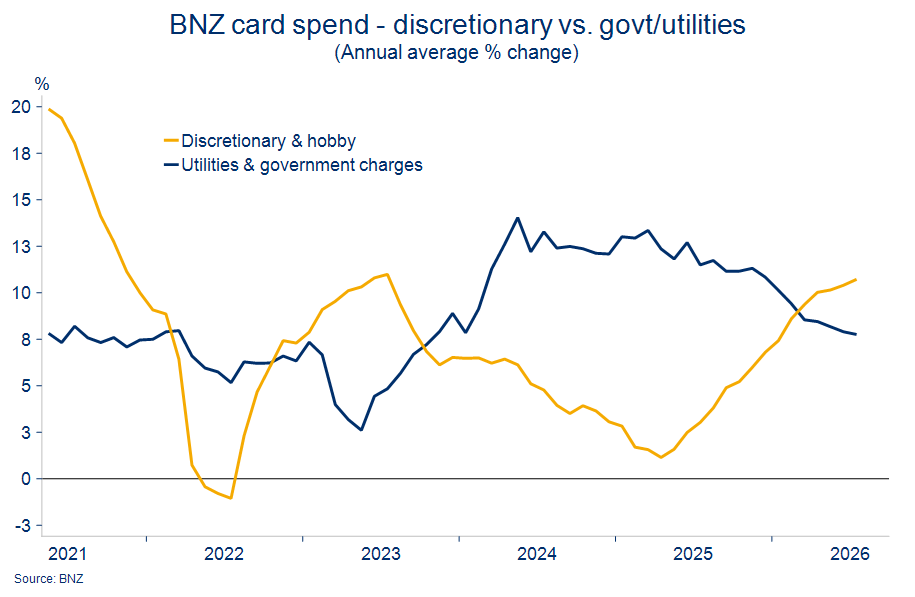
Our own card spending data corroborate evidence of a steadying in the NZ spending pulse. Topline (nominal) spending growth rose over June and July, having drooped a little prior.
But it’s amongst the sub-categories where things have been more interesting. We’ve been eyeing the slow and steady rise in ‘discretionary & hobby’ spending growth. That’s occurred, notably, as growth in ‘utilities & government charges’ has gone the other way. The latter is likely (mostly) a price story. Price rises in utilities and government continue, but peak inflation in these categories appears to be passing.
Fun vs. bills
4. June tourism and long-term net migration
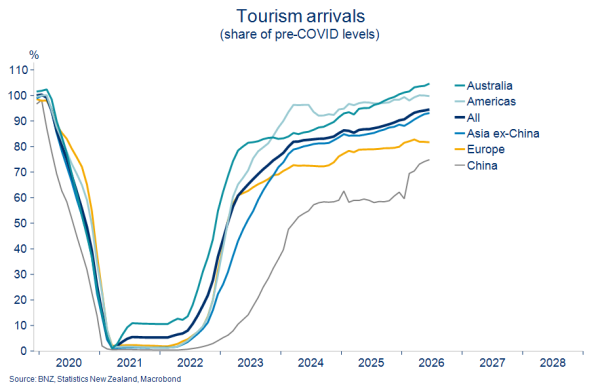
Tourism spending has been an important prop for the retail sector, particularly in the South Island. Figures out on Friday showed tourist arrivals into South Island airports hit a fresh record high in the year to June. NZ-wide arrivals have climbed to 94% of pre-COVID levels.
It’s true the pace of recovery has throttled back in recent months, perhaps indicative of some consumer wariness post the fuel price shock and higher airfares. But we retain a positive underlying view.
The recent step back up in Chinese tourist numbers (75% of pre-COVID levels) is certainly helpful, particularly if the buoyancy in those coming from Australia (105% of pre-COVID levels) cools as the Australian economy enters a softer patch.
Tourism arrivals maintain uptrend
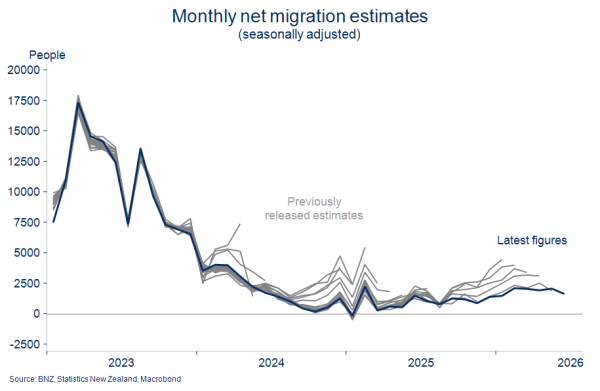
Population growth is another important driver of retail spending. But, in contrast to the updrift in tourist arrivals, the lift in net migrant arrivals we’ve previously talked about has flattened. Indeed, a chunk of it has been revised out of existence.
Last week’s June data put annual net migration at an estimated 17,600. That’s above the 9,500 cycle lows of 2025 but is still a ways below the 30,000 long-run average. What’s more, and as the chart shows, the tendency of Stats NZ to revise down prior estimates of net migration has continued. It’s getting much harder to eyeball an uptrend in the monthly numbers.
Monthly migration looking increasingly flattish
Overall
Pulling the threads together, it’s all a bit mixed and uneven, but there’s enough in the latest data to support the idea a shaky underlying recovery in spending activity continues.
Fuel price volatility does cast a pall over the outlook and makes it difficult to distil trend from noise month-to-month. Fuel price declines may have provided a leg-up over June and July, but who knows what happens from here. Fuel prices have been rising again more recently and this week’s lift in oil prices risks that continuing.
Consumers also continue to face into challenging conditions from high inflation, a tough jobs market, flat house prices, and rising mortgage rates. All of which are likely to stick around this year.
Our view is thus that positive but sub-par consumer spending growth will remain a feature of the recovery until such time as inflation and unemployment, in particular, start falling.
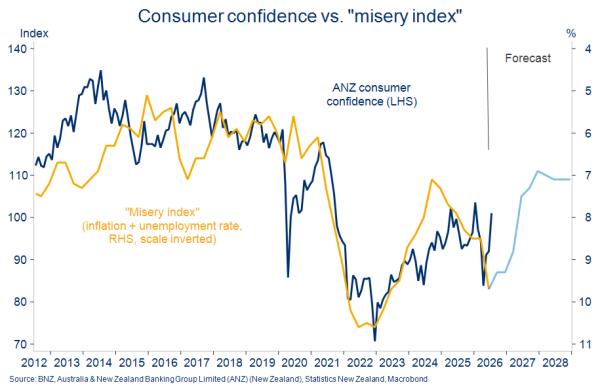
The two are sometimes combined into what is cheerily termed the “misery index”. With annual inflation at 4.1% and the unemployment rate at 5.6%, the index currently yields an uncomfortable 9.7% – the highest since mid-2023. Inverting the index, per the chart, reveals an unsurprising correlation with consumer confidence.
Based on our forecasts for inflation and unemployment, the misery index has peaked. Assuming we don’t get any more nasty surprises, the coming 12 months is shaping up as less “miserable” for consumers.
Misery index peaked?
Interest rates
There’s been little in the recent news flow to shift interest rate expectations.
We continue to expect the Reserve Bank to lift the OCR a further 25bps to 2.75% at its September meeting in a fortnight’s time. So does the market, with such an outcome priced with a circa-90% probability.
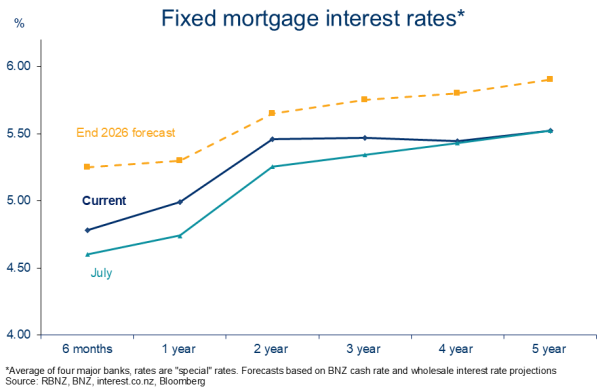
Over the past month, fixed mortgage rates have nudged up 15-25bps in the six-month to three-year part of the mortgage rate curve. It’s largely a catch up to prior moves in wholesale rates.
The result is a mortgage curve that is unusually kinked; relatively flat for 2-5 year fixed terms, with six month and one-year term rates noticeably lower. That might further nudge borrowers’ term preference back towards one-year. In June, one-year fixed terms comprised 24% of new mortgage lending, up from 21% in April.
Mortgage curve kinked
To subscribe to Mike’s updates click here.
- Economy & Markets